Setting Up Kube-Prometheus-Stack on Kubernetes Services
This setup will install the application stack of Prometheus and Grafana together on a K8 Kubernetes Cluster.
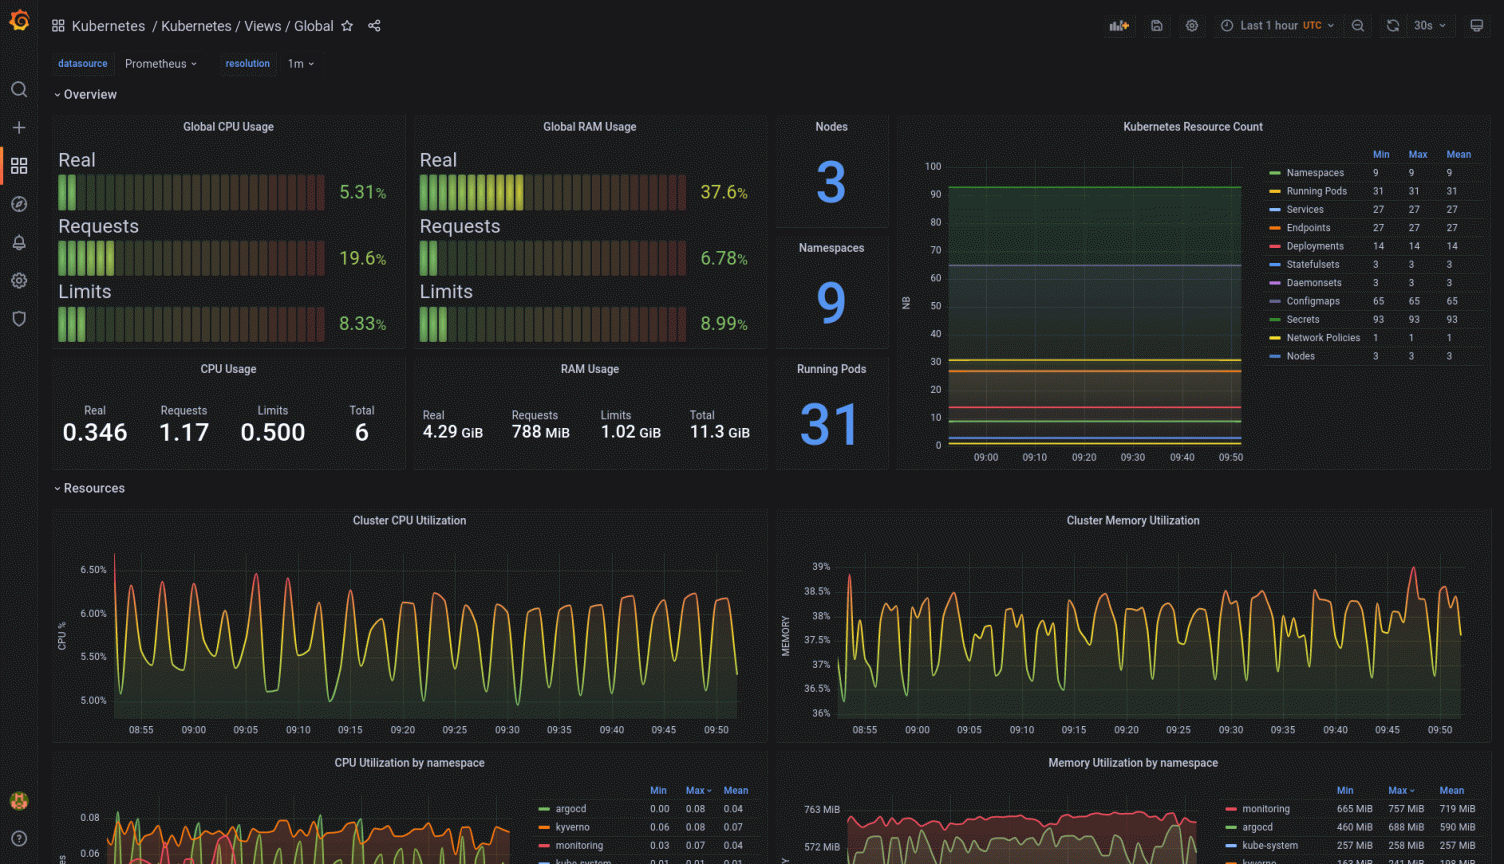
Great Dashboards comes out of the box with the application-stack.
Prerequisites:
-
Kind-Cluster (or others cluster) with Ingress-controller (HTTPS or DNS challenge) configured
If you don’t want use an ingress you can access over a port-forwarding to load the grafan gui!
# Update the Helm repositorieshelm repo update# Add the Kube Prometheus Stack Helm repositoryhelm repo add prometheus-community https://prometheus-community.github.io/helm-charts
create config file: kube-prometheus-values.yaml
# Sample kube-prometheus-values.yamlprometheus:enabled: truealertmanager:enabled: truegrafana:enabled: true
Run installation:
# Create the "monitoring" namespacekubectl create namespace monitoring# Deploy the Kube Prometheus Stackhelm install kube-prometheus-stack prometheus-community/kube-prometheus-stack -n monitoring -f kube-prometheus-values.yaml# Deploy the nginx ingresshelm install ingress-nginx ingress-nginx/ingress-nginx \--namespace monitoring \--set controller.service.annotations."service\.beta\.kubernetes\.io/azure-load-balancer-health-probe-request-path"=/healthz
Ingress config standard option #1 – Create config file: grafana-ingress.yaml
# Sample grafana-ingress.yamlapiVersion: networking.k8s.io/v1kind: Ingressmetadata:name: grafana-ingressnamespace: monitoringspec:rules:- host: *http:paths:- path: /pathType: Prefixbackend:service:name: kube-prometheus-stack-grafanaport:number: 80
If you want ingress with lets-encrypt and bot urls for Grafana and Prometheus then use option #2, this example:
For this example i have created the according DNS entry´s on Hetzner before with the according IP Address of the VM vsphere machine!
apiVersion: networking.k8s.io/v1kind: Ingressmetadata:name: grafana-ingressnamespace: monitoringannotations:kubernetes.io/ingress.class: "nginx"cert-manager.io/cluster-issuer: "letsencrypt-staging"### Uncomment for production usage# cert-manager.io/cluster-issuer: "letsencrypt-production"spec:tls:- hosts:- laborgraf.youredomain.desecretName: laborgraf.youredomain.derules:- host: laborgraf.youredomain.dehttp:paths:- path: /pathType: Prefixbackend:service:name: kube-prometheus-stack-grafanaport:number: 80---apiVersion: networking.k8s.io/v1kind: Ingressmetadata:name: prometheus-ingressnamespace: monitoringannotations:kubernetes.io/ingress.class: "nginx"cert-manager.io/cluster-issuer: "letsencrypt-staging"### Uncomment for production usage# cert-manager.io/cluster-issuer: "letsencrypt-production"spec:tls:- hosts:- laborprom.youredomain.desecretName: laborprom.youredomain.derules:- host: laborprom.youredomain.dehttp:paths:- path: /pathType: Prefixbackend:service:name: kube-prometheus-stack-prometheusport:number: 9090
run kubectl apply -f grafana-ingress.yaml
- Access the Grafana dashboard using the external IP or hostname / url configured for the Ingress.
- Log in to Grafana using the initial username and password.
”admin / prom-operator” - Navigate to the Configuration section and click on “Add data source”.
- Select “Prometheus” as the data source type.
- Configure the URL of the Prometheus server. By default, it should be `http://prometheus-operator:9090`.
- Save and Test the connection. Upon successful connection you can see a success message.
- Now you can navigate to the Dashboard section and check the available dashboards.
- Change the initial Password !